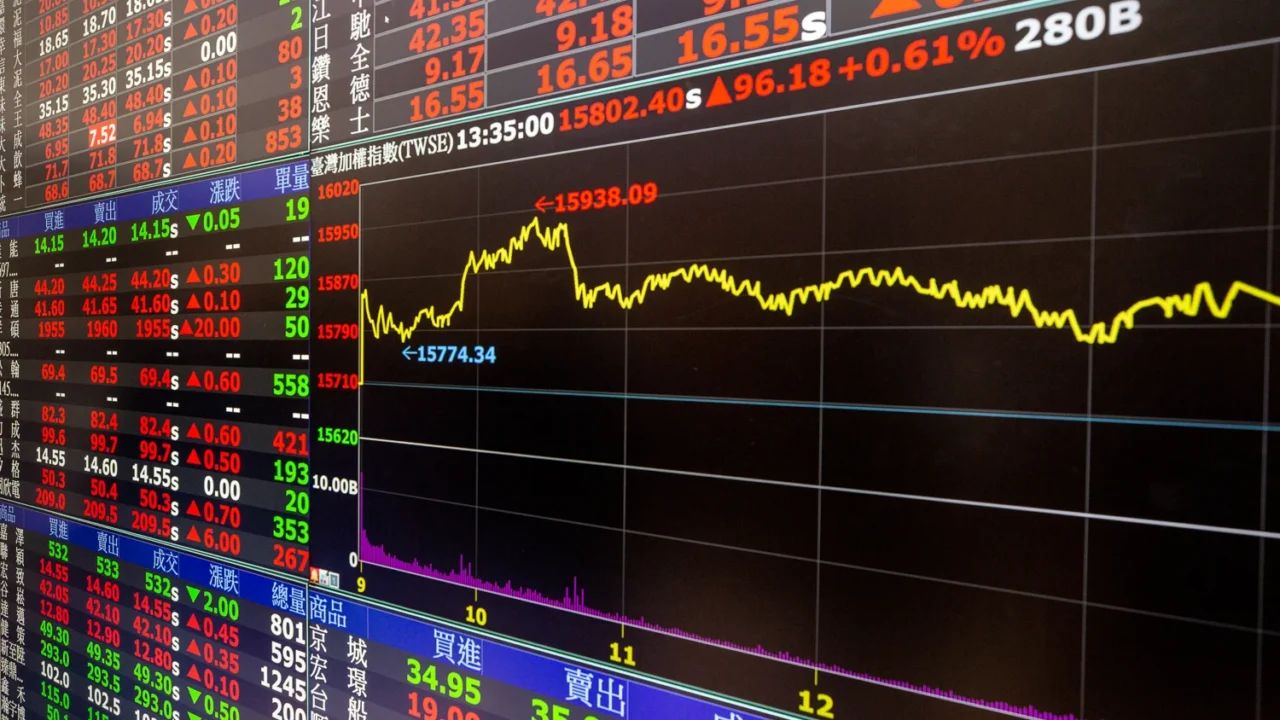
A price that doubles is not automatically a bubble. Perhaps the company has invented a useful product, profits have increased, or investors expect justified changes. We speak of a financial bubble when a rise is driven, to a significant extent, by the expectation that others will pay even more, rather than by sustainable economic fundamentals.
The circle of enthusiasm
Imagine a company with promising results. The initial rises attract investors, the media talk about it, and demand surges. New buyers interpret the same price increase as proof that the company is worth more. Thus a cycle appears: the price rises, attention increases, and the new attention pushes the price up again.
This process can be amplified with cheap credit, leverage, or leveraged instruments. When many investors need to sell at once, the same dynamic works in reverse. The SEC warns that operations driven by social media trends can result in very rapid losses.
Example: the price rises ten times faster than the business
Suppose a fictional company that generates €10 million in revenue and is valued at €50 million on the stock exchange: its price-to-sales multiple is 5. Two years later it generates €12 million in revenue, but the market values it at €150 million. The multiple has risen to 12.5.
This difference does not by itself prove there is a bubble; perhaps the business expects larger future margins. But it does compel the question of what future results would justify paying this new price. If no one can explain them without repeating ‘it will keep rising’, we have an alarm signal.
Three indicators that should be examined together
First, the revenues, profits and cash flows that could sustain the value. Second, the valuation multiples compared with the risk and with similar companies. Third, who is buying and why: a heavy reliance on leverage or viral expectations can make the market more fragile.
Liquidity and concentration also matter. An asset traded by few people can show spectacular prices and, at the same time, be very difficult to sell without making important concessions.
Why is it difficult to know when it will explode?
An exacting valuation can persist for years. Identifying overvaluation does not provide a date for the fall. That is why very secure predictions about the exact moment of a crash are often unreliable.
The key idea: the question is not only how much an asset has risen, but what business, what risk and what expectations explain that price.
What can a hypothetical housing case teach us?
Assume that in a neighbourhood the average house price rises from €200,000 to €320,000 over five years, while annual rents rise from €10,000 to €11,000. The price-to-rent ratio has moved from 20 to approximately 29. This change is not definitive proof of a bubble, but it means that buyers are paying more for every euro of annual income that the property could generate.
To interpret this, one would also need to investigate mortgage rates, housing supply, population, salaries, regulation, and maintenance costs. If an analysis ignores these variables and simply extrapolates the price graph, it confuses a past trend with a reliable forecast.
Bubbles are better diagnosed with multiple indicators rather than with a single numerical rule.
Bubble or deep economic change? The difficult distinction
A bubble cannot be identified simply because an asset has risen sharply. If a company discovers a new market, increases sales, and improves margins, part of the rise in its share price may reflect reasonable expectations of future profits. The problem arises when the price incorporates such extraordinary growth that almost any realistic result will disappoint buyers. At this point, the share price stops depending mainly on expected economic flows and starts depending on finding another person willing to pay even more.
Imagine two fictitious companies trading at €20. The first doubles its earnings per share and rises to €30; the second maintains the same earnings but rises to €100. The second could have a promising future, but one must justify why the market is willing to pay five times more for the same current result. There is no universal threshold that automatically converts this difference into a bubble: one must know about debt, growth, competition, interest rates, and the quality of the accounts.
The psychological phases of a rise
In the early stages, buyers usually have concrete arguments: an innovation, a fall in interest rates, or an improvement in activity. Later, if the price rises, a second motivation appears: not to be left behind. This fear of missing out, known as FOMO, can turn each new rise into a justification for the next. Personal success stories become more visible than the prudent decisions of those who preferred not to buy.
In a later phase, people may start to accept risks they previously considered excessive. For example, taking on debt to buy an asset, concentrating all savings in a single sector, or assuming the price will not fall again. Additional demand pushes valuations even higher and seems to give the promoters the right. This mechanism can be reversed with the same speed: if early sellers reduce prices, leveraged investors may have to liquidate positions and accelerate the correction.
A signpost table, with its limitations
| Signal to observe | Why it is relevant | Why it is not a definitive proof |
|---|---|---|
| Prices that grow much faster than incomes or rents | Indicació de desconnexió del valor econòmic | Els ingressos futurs també poden variar |
| Crèdit fàcil i endeutament elevat | Amplificació de compravendes forçoses | El crèdit pot finançar inversions productives |
| Guaranteed profit stories | Reduce the perception of risk | Exaggerated advertising does not explain the whole market |
| Few companies concentrate the gains | The market may depend on a small group | Some sectors have very dominant leaders |
| Valuations compared with previous years | Reveal changes in expectations | Macroeconomic conditions may be different |
The useful reading is joint. An isolated indicator can generate false positives; several indicators that worsen at the same time justify more demanding questions about the price.
Own example: a rented shop and three possible prices
Let’s assume a shop that generates 12,000 € in net annual rent before personal taxes and extraordinary repairs. If it is bought for 200,000 €, the simplified yield before personal taxes and extraordinary repairs is 6 %. If after two years it is sold for 300,000 € and the rent continues at 12,000 €, it falls to 4 %. If the price reaches 480,000 €, it drops to 2.5 %.
This does not demonstrate that there is a property bubble: perhaps the neighbourhood has changed, the building will gain value, or there will be higher future rents. But it does force the question of which evolution of rents or risk explains paying 480,000 € for the same current cash flow. Who buys simply because «the shop goes up every year» is making a different bet than who calculates the income they could obtain from it.
Why is it so difficult to act before the crash?
Time is the great difficulty. A valuation may seem excessive for years before it is corrected, and it may also stabilise while profits grow. That is why announcing exactly when a bubble will burst is far less reliable than examining what risks there are if expectations are not met. One must distinguish a critique of valuations from a calendar prediction.
In a family economy or a small business, the most useful question is not to guess the maximum, but to assess whether a substantial decline jeopardises daily expenses, loan guarantees, or the ability to continue operating. This is a way of thinking about scenarios, not a recommendation to buy or sell.
How to read the news without falling into exaggerated conclusions
When you see «prices have risen by 40%», always check against which date, whether it is an average or a median, whether it includes dividends or rents, and whether the composition of the studied set has changed. A city may show a rise in the average housing price simply because more large flats have been sold in expensive areas. A stock index may rise due to a few very heavy companies. The data is not necessarily false, but the headline may be insufficient.
A good analysis of a possible bubble explains what has become expensive, what has happened to the income it generates, what role credit plays, and what economic alternative the buyer would have. Without these pieces, there is only a narrative about prices.
Sources and complementary reading
- https://www.investor.gov/introduction-investing/general-resources/news-alerts/alerts-bulletins/investor-alerts/investor-alert-thinking-about-investing-latest-hot-stock-understand-significant-risks-short-term
- https://www.investor.gov/introduction-investing/investing-basics/glossary/market-capitalization
Photograph: File:Market data on display at Taiwan Stock Exchange 20210208.jpg — Oficina de la Presidència de Taiwan — CC BY 2.0 (resized and converted to WebP).

Educational notice
This content is for educational and informational purposes. It does not constitute financial advice or an investment recommendation.